People Talking About
“How many people should I get to ‘like’ my Facebook page?” That’s a question I get on a regular basis.
The polite answer is, “You should always be working to give your heavy listeners reasons to ‘like’ your Facebook page.” The more pointed answer is, “Quit looking at that number! It’s telling you nothing!”
To keep your Facebook analytics as simple as possible, let me tell you about the one number you should be paying attention to. It’s basically a measure of all the activity on or around your page. So, when people do any one of a number of things … liking, sharing, or commenting on a post; tagging one of your photos; mentioned your page to their friends; and so on … it adds to your total of People Talking About your brand. Here’s how to find it.
STEP 1
Make sure you see this strip at the top of your station’s page. If you don’t, you’re not an administrator. Whoever does have admin rights can fix that easily for you. You’ll need to take care of that so you can move on.
![]()
STEP 2
If the button all the way on the right says “Show” instead of “Hide,” click it so it says “Show” and your Admin Panel opens up.
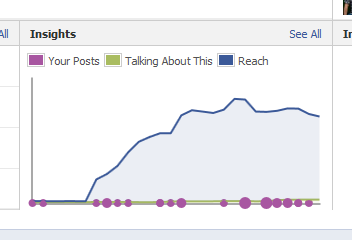
Note the box in the middle of the page marked “Insights.” This graph is a headline summary of your stats you’re about to look at. Click that link that says “See All.”
STEP 3
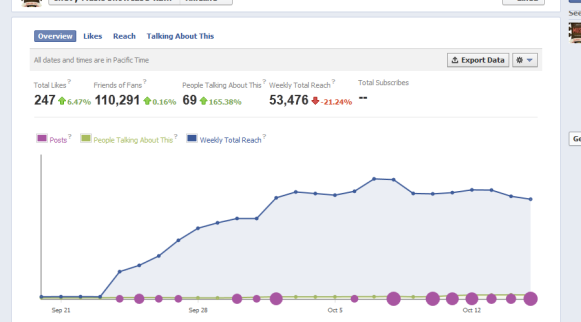
Here’s what you’ll see next —
 This is a summary view of your Facebook stats. Some other time, you might want to poke through Likes and Reach (start with Reach first, it’s more meaningful). Click “Talking About This,” and we’ll take a look at that.
STEP 4
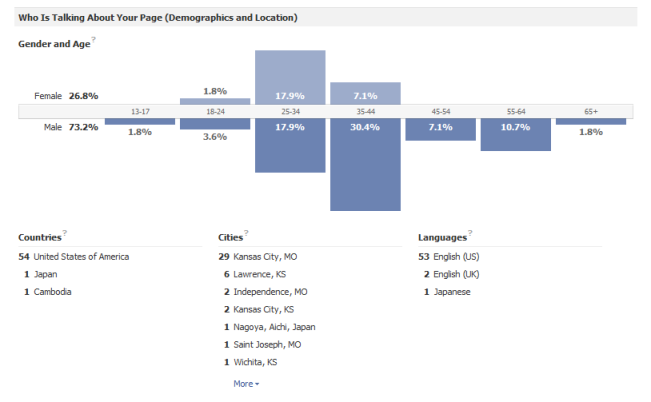
Once you’re on your “Talking About This” page, the first information you’ll see is who is talking about you.  You’ll see it breaks it down, graphically, by age and gender cells. Below that graph is information about where your page fans are. I find that these numbers are incomplete; Facebook can access this info for many people, but not all. Then, scroll down the page for the next, more important information ….
STEP 5
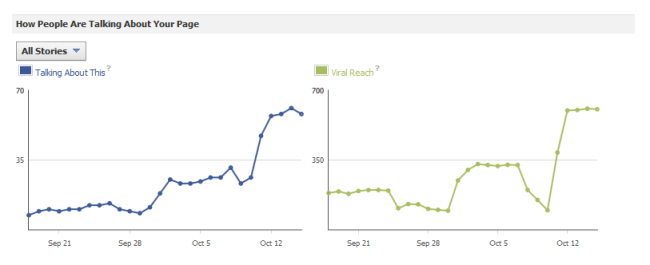
As you see, these are Facebook’s graphs about how people are talking about your page. Yes, there’s a graph on the right about viral reach, but that’s driven by the graph on the left, the “Talking About This” graph. You can use the drop-down menu to see how different sorts of content you posted performed, but I’d recommend focusing on the “All Stories” number for now.
There’s a dot on that line graph for each day in the time period being measured. It’s not a summary for that day, however. Each dot is a 7-day running total of your “People Talking About” numbers. In other words, the dot for October 12th is a summary of October 6th through October 12th. The next day, the 13th, dropped the oldest day and added the newest day, so that dot covers October 7th through October 12th. If you hover your mouse over any of those dots on your page, you’ll see the 7-day total for that dot.
A way for radio folks to think about this is that Facebook Likes are like cume; People Talking About is like AQH persons. People Talking About is valuable because it’s a good reading of not just how many fans you have, but how much they’re engaging with you.
One final warning … don’t limit yourself to Facebook analytics. See how it fits into your brand (and all your platforms) as a whole. What’s still most important is if you are moving people to your various platforms where you can measure them and take advantage of them. That might be tune-ins for a special feature; an increase in your streaming stats; more website visitors, going to pages you link to from Facebook; and on and on. However, nothing happens until your fans see your posts in their news feed. The chances of that happening are much greater if you bring up your People Talking About stats.

